
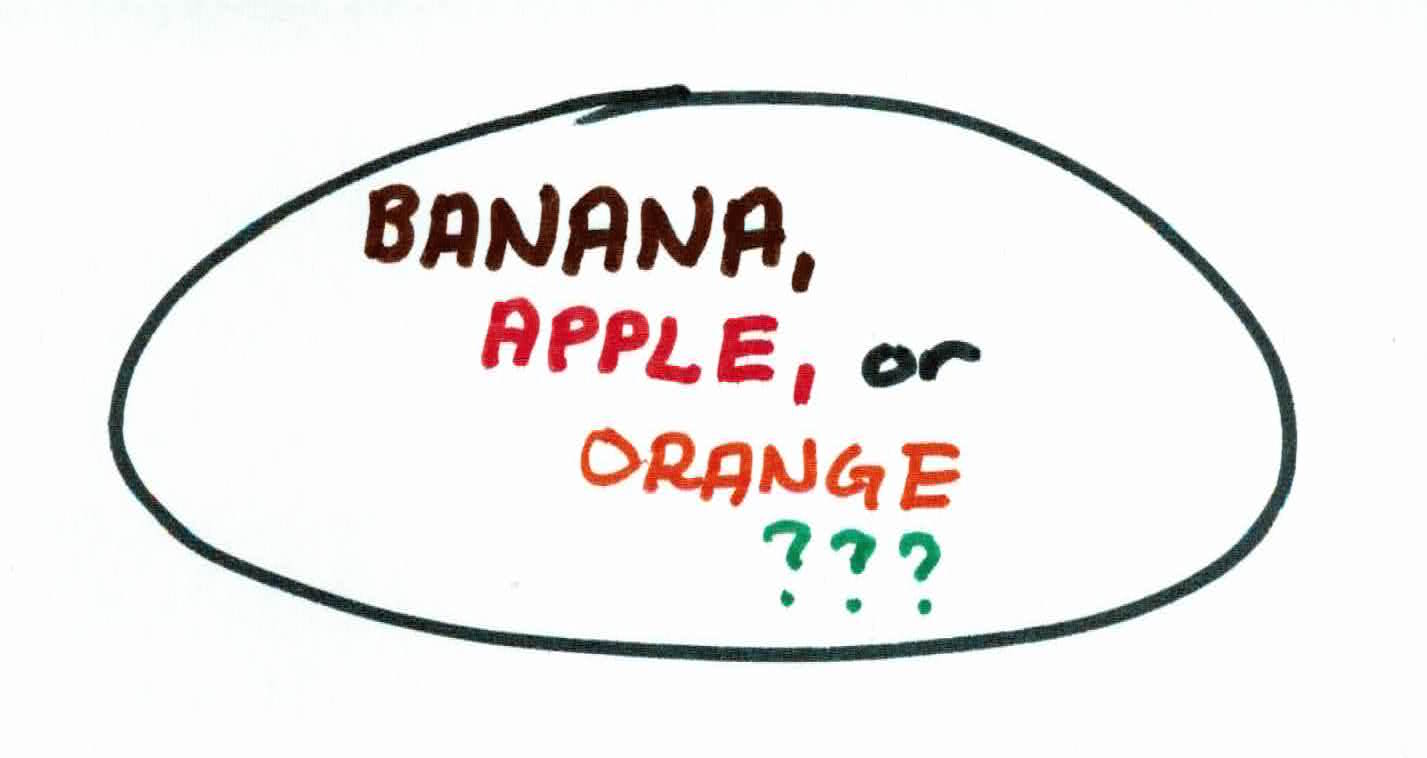
Decision Trees are supervised learning methods used for classification and regression. In a tree structure, nodes represent attributes of the data, branches represent conjunctions of features, and the leaves represent the labels. Using the C4.5 tree generation algorithm, at each node, C4.5 chooses the attribute of the data that most effectively splits its set of data so that each split's labels are as homogenous as possible. The C4.5 algorithm then recurs on the smaller splits until convergence. The goal is to build rules to reach a conclusion (label), i.e. if color is orange and shape is round then it is an orange.
The setting is Captain America 2: The Winter Soldier. In this scene, Captain America discovers that Arnim Zola has his consciousness preserved in a supercomputer.
Arnim Zola reveals that HYDRA (basically the Nazis) have been secretly operating within the ranks of S.H.I.E.L.D (basically the FBI & CIA), staging terrorists attacks with the mission of making humanity surrender its freedom in exchange for security.
It is later conveyed that Zola developed a data-mining algorithm that can identify individuals who might become future threats to HYDRA's plans. The Insight Helicarriers will sweep the globe, using satellite-guided guns to eliminate these individuals.

How does Zola's algorithm work? Let's assume he's using a decision tree (which actually may be the case). Zola stated that they predict who will become a future threat by social media, voting patterns, bank records, and even SAT scores. Zola's job is to deter any future threat to HYDRA. The data that Zola currently has is information on 7 billion people. Out of the billions people, he knows who is currently a threat and who isn't (labels). But he wants to use this data to learn rules that will be able to predict whether people in the future will be a threat.

To learn these rules, Zola must find which traits (features) tell the most about someone, and keep reiterating and building off that. Having the trait blue eyes wouldn't really help as the first rule to best split data between people who are a threat or not. It would have too small of an effect, if any. On the other hand, checking for voting patterns as a first rule could work. People who would vote for a monarchist would be usually deemed safe, while people who vote against it would usually be viewed as a threat to HYDRA.
Now, just because you would vote against a monarchist doesn't necessarily mean HYDRA should waste it's resources on worrying about you. So, they find a second rule to add on to their first rule, i.e. If you voted against a monarch AND you have superpowers, you are a threat! The goal is to keep adding rules, and filtering data, building a tree in the process, until all of the leaves contain whether a person should be viewed as a threat or not.
A decision tree is grown from the root downward. At each iteration, the algorithm will find the feature that will split the data the best, building rules each iteration and eventually converging to an answer. The idea is to send the examples down the tree, using the concept of information entropy. The general steps to building the tree are relatively easy. Start with the root node that has all the examples.
Then you do a greedy selection of the next best feature to build the branches. You try to find the feature that will give you the most information about your data, i.e. feature that separates the label the best.
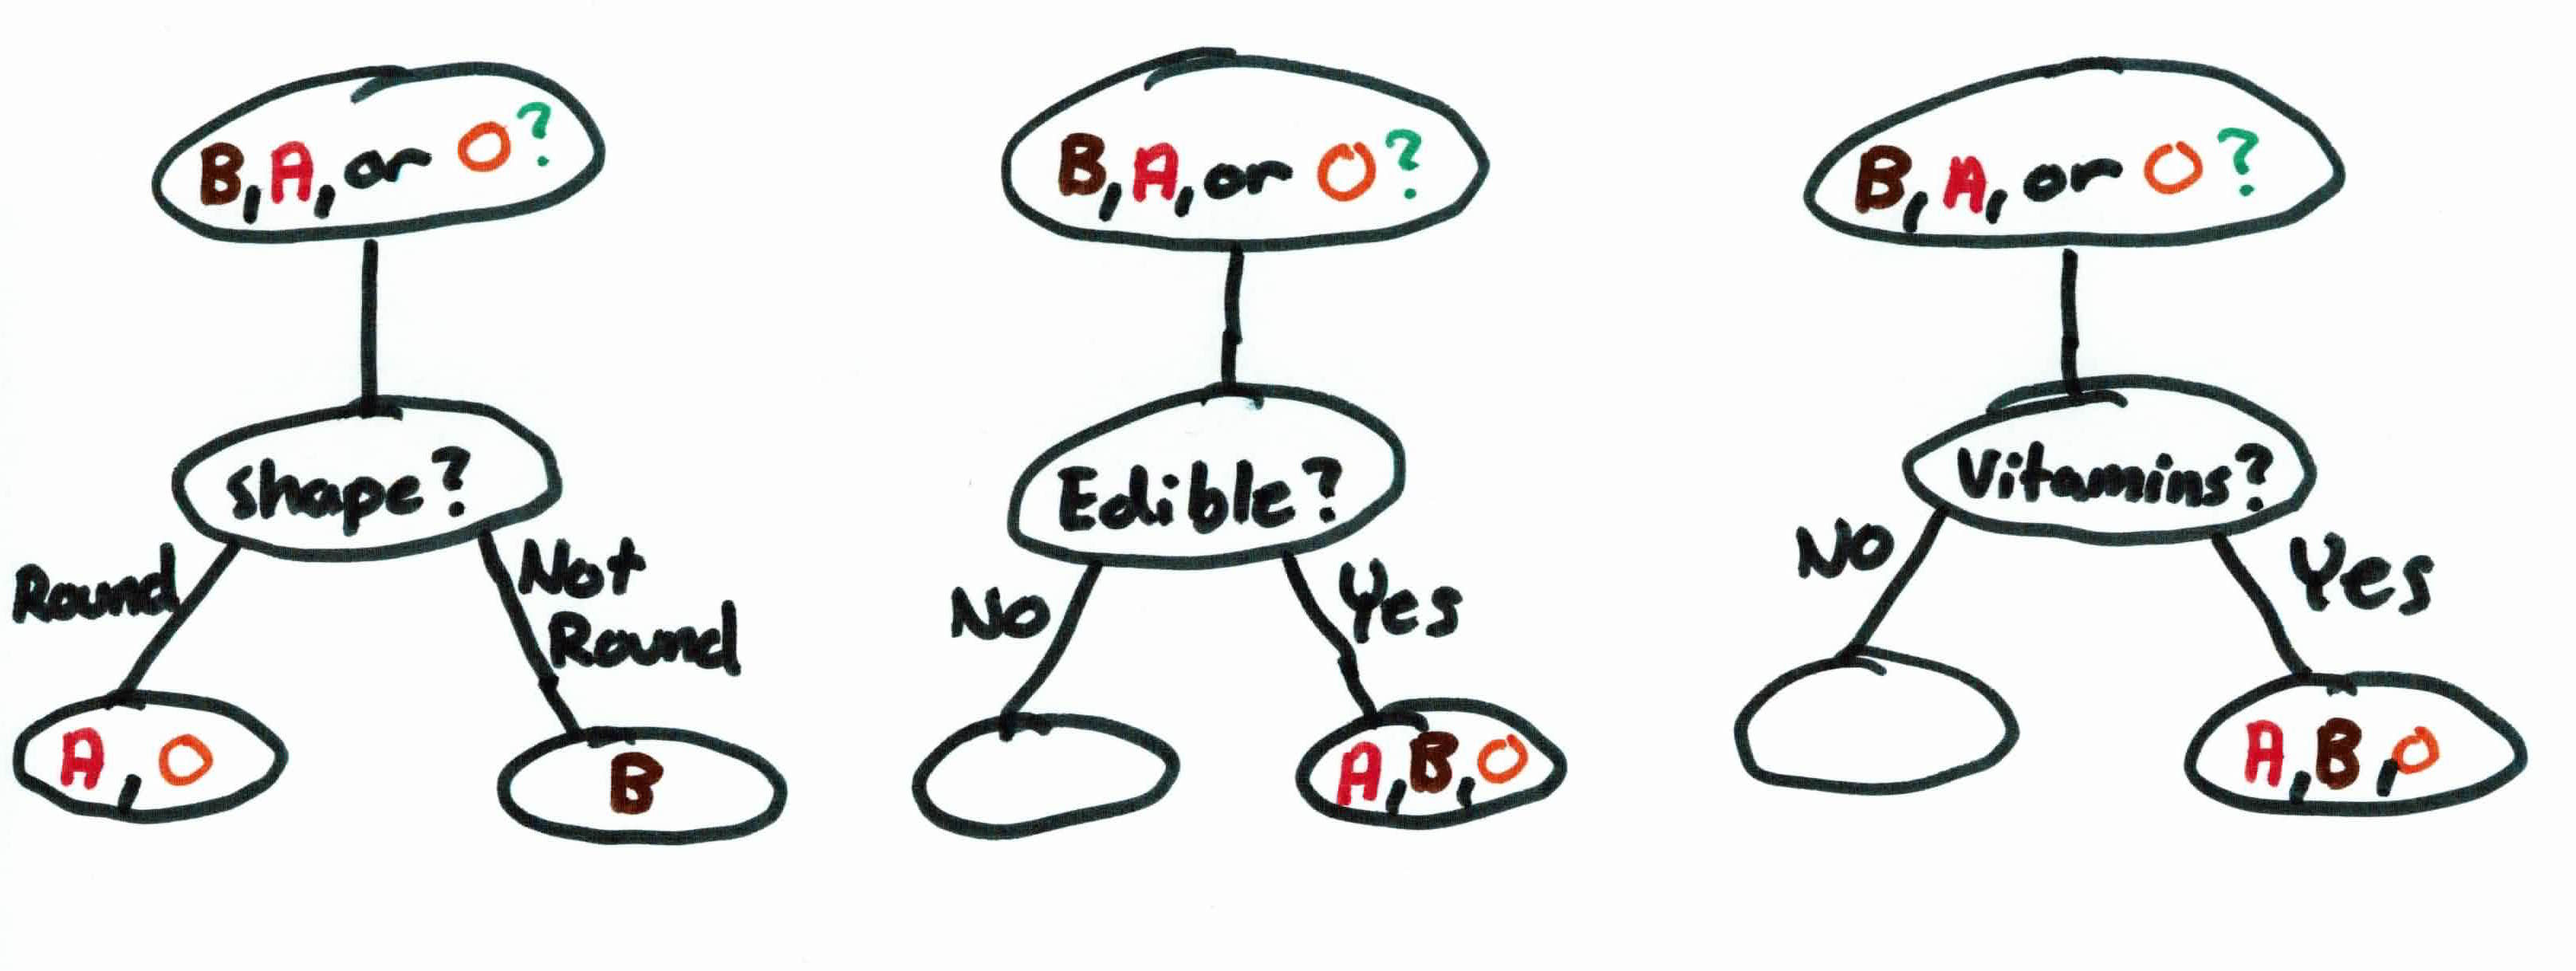
As you can see from above, we have 3 possible rules/attributes that can split the data: shape, edible, vitamins. Edible and vitamins filter the data extremely poorly as all of them are edible and have vitamins. Shape on the other hand can split the data pretty well. This process repeats until all leaves have uniform labels (all bananas, all oranges, etc.) or until a preset max number of iterations. If the latter, then the class majority will be assigned to the leaves.
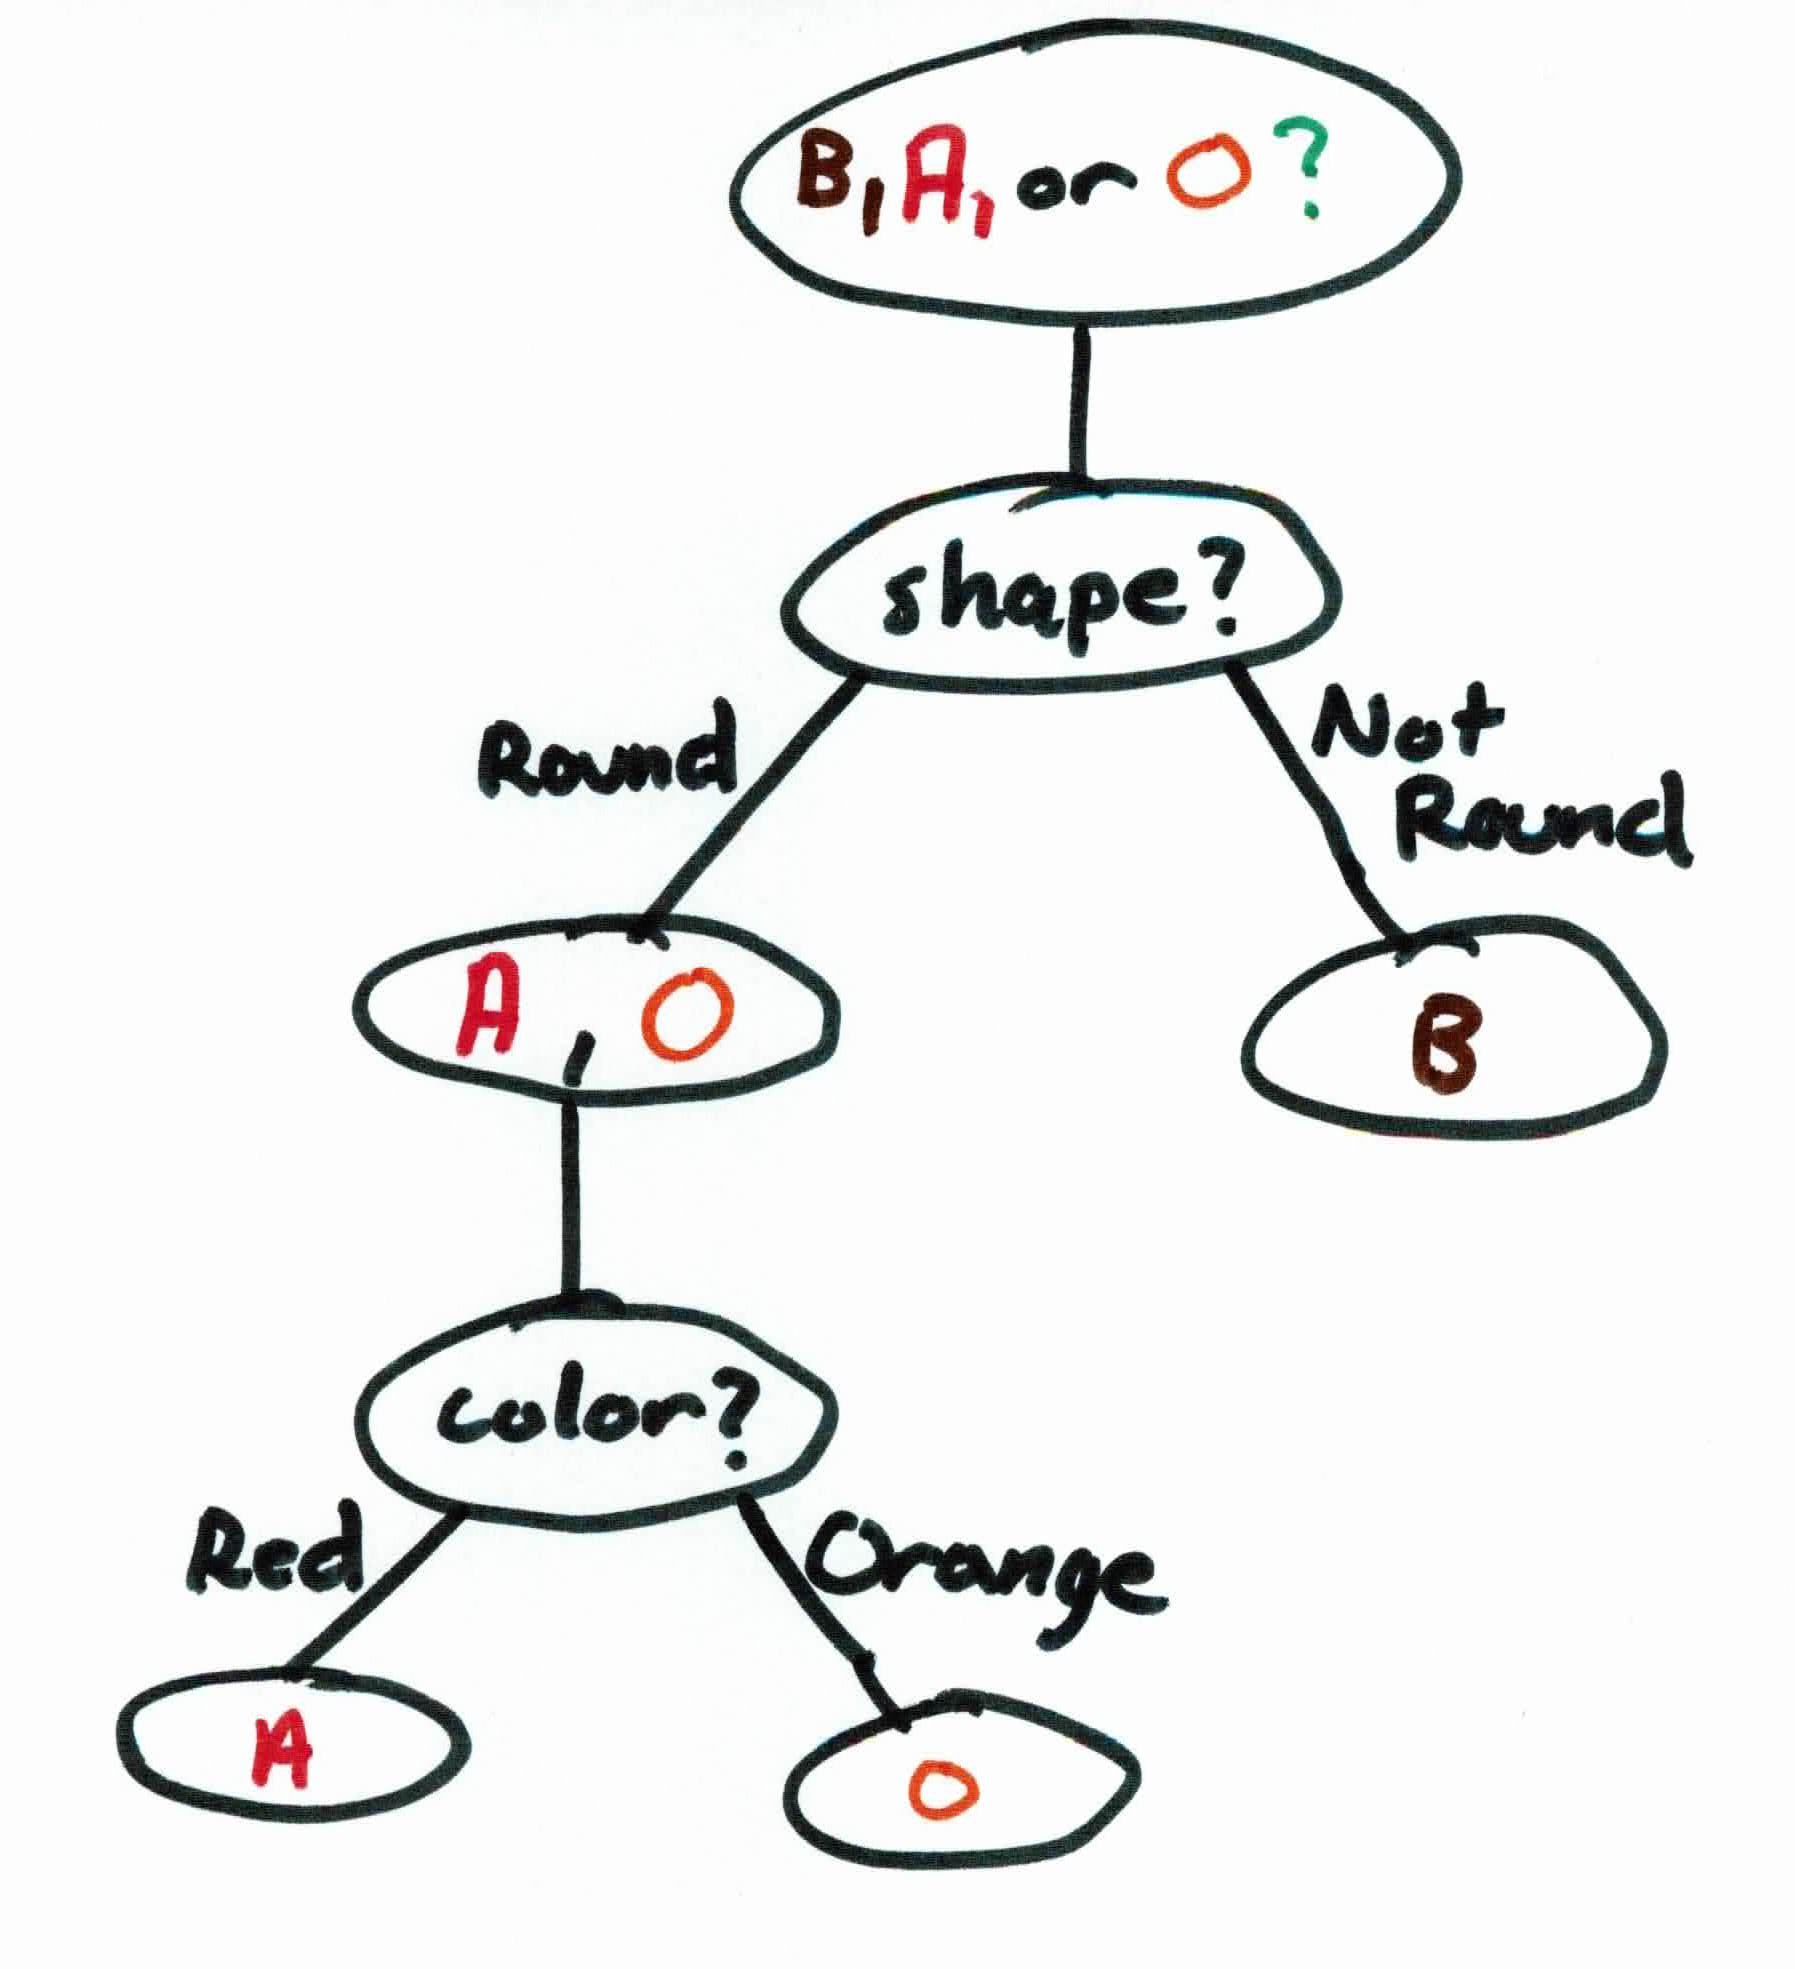
Repeating the process on the remaining data that needs filtering (apple and orange), we use the attribute color. The possible values for the attribute are red or orange. As you can see below, the data is now perfectly filtered.
To generate a tree from our data, we will use the C4.5 algorithm. You will always be given training data $(x_1, y_1), \dots, (x_n,y_n)$, where $x_i \in \mathbb{R}^d$ and $y_i$ is discrete (categorical/qualitative), $y_i \in \mathbb{Y}$.
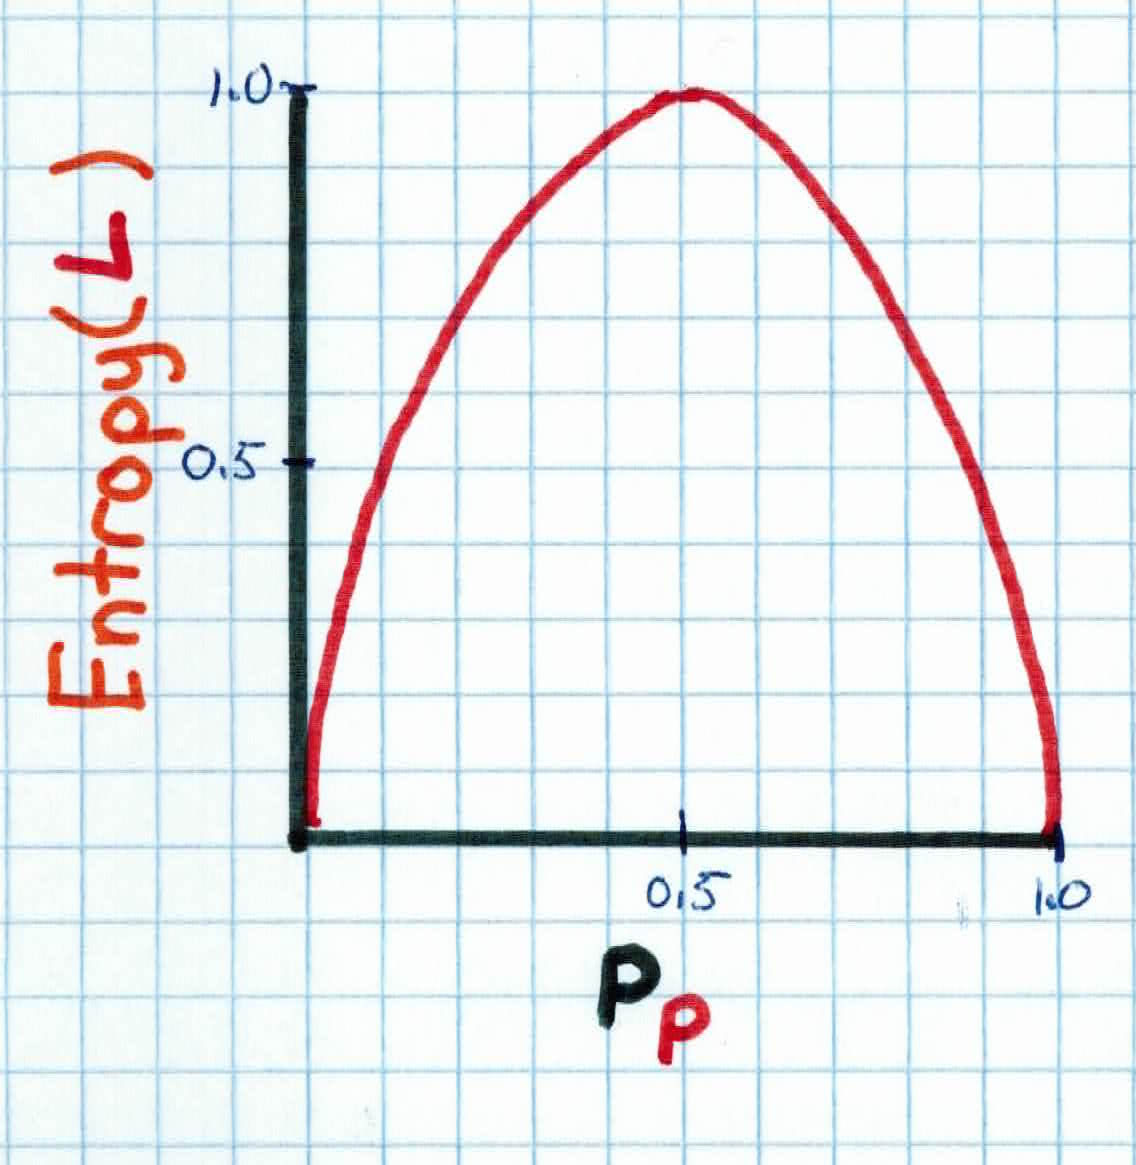
We initially place all examples in the root node. The central choice is selecting the next attribute to split on. We want a function that will tell us which attribute can we split at to gain the most information. In order to do this, we must first take a digression to discuss entropy. Entropy is a criteria that measures the homogeneity or impurity of examples in the nodes and is given as:
$$Entropy(L)=-p_{p}log_2 ( p_{p}) - p_{n}log_2 ( p_{n})$$
where $p_{n}$ is proportion of negative examples, and $p_{p}$ is proportion of positive examples. $L$ is the set of all examples' labels.
In general, for $c$ classes:
$$Entropy(L) = \sum_{i=1}^c -p_i \ log_2 (\ p_i)$$
As you can see, entropy is at it's maximum if there is an equal number of examples in each class, and minimum if the node is pure. We want our final tree to have minimum entropy, because that means that at each of our leaf nodes, we have pure, uniform classes.
Now that each node has some entropy that measures the homogeneity in the node, how do we decide which attribute is best to split on based on entropy?
We use Information Gain that measures the expected reduction in entropy caused by partitioning the examples according to the attributes:
$$Gain(L, A)= Entropy(L) - \sum_{v \in Values(A)} \frac{|L_v|}{L} Entropy(L_v)$$
Where $L$ is the set of all examples' labels and $A$ is the attribute, i.e. color, taste, etc. So, $v$ would be the values, i.e. $Values(color) = { red, green, blue, pink }$. $L_v$ would be the set of labels that have the value $v$.
Stare at the equation long enough and you'll notice that information gain is simply telling you how much you will reduce your entropy at your (current) node if you were to use the attribute to split.
At the first split starting from the root, we choose the attribute that has the max gain.
So, we calculate the information gain of splitting at every attribute and choose the attribute with the highest gain. We then restart the same process at each of the children nodes (if node not pure) with the remaining set of features until we have a full tree.
Given a training set ${(x_1, y_1), \ldots (x_n, y_n)}$, the tree generation (C4.5) algorithm works like this:
Using our example from above, you want to help HYDRA predict whether or not someone will be a threat to their plans. You are given a training set of people for your algorithm to learn from so that it can predict and prepare for future threats.
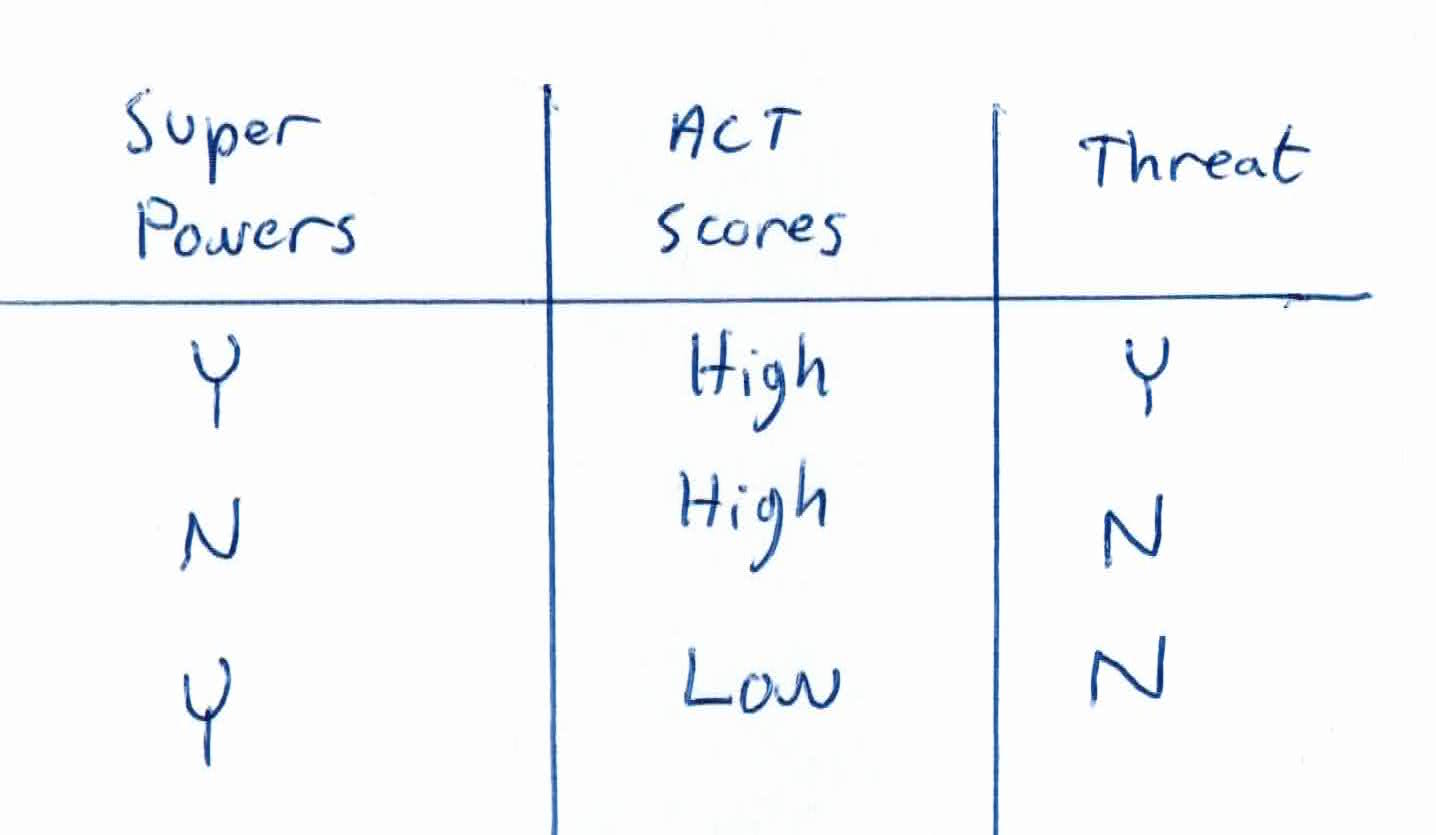
The given training data is as follows:
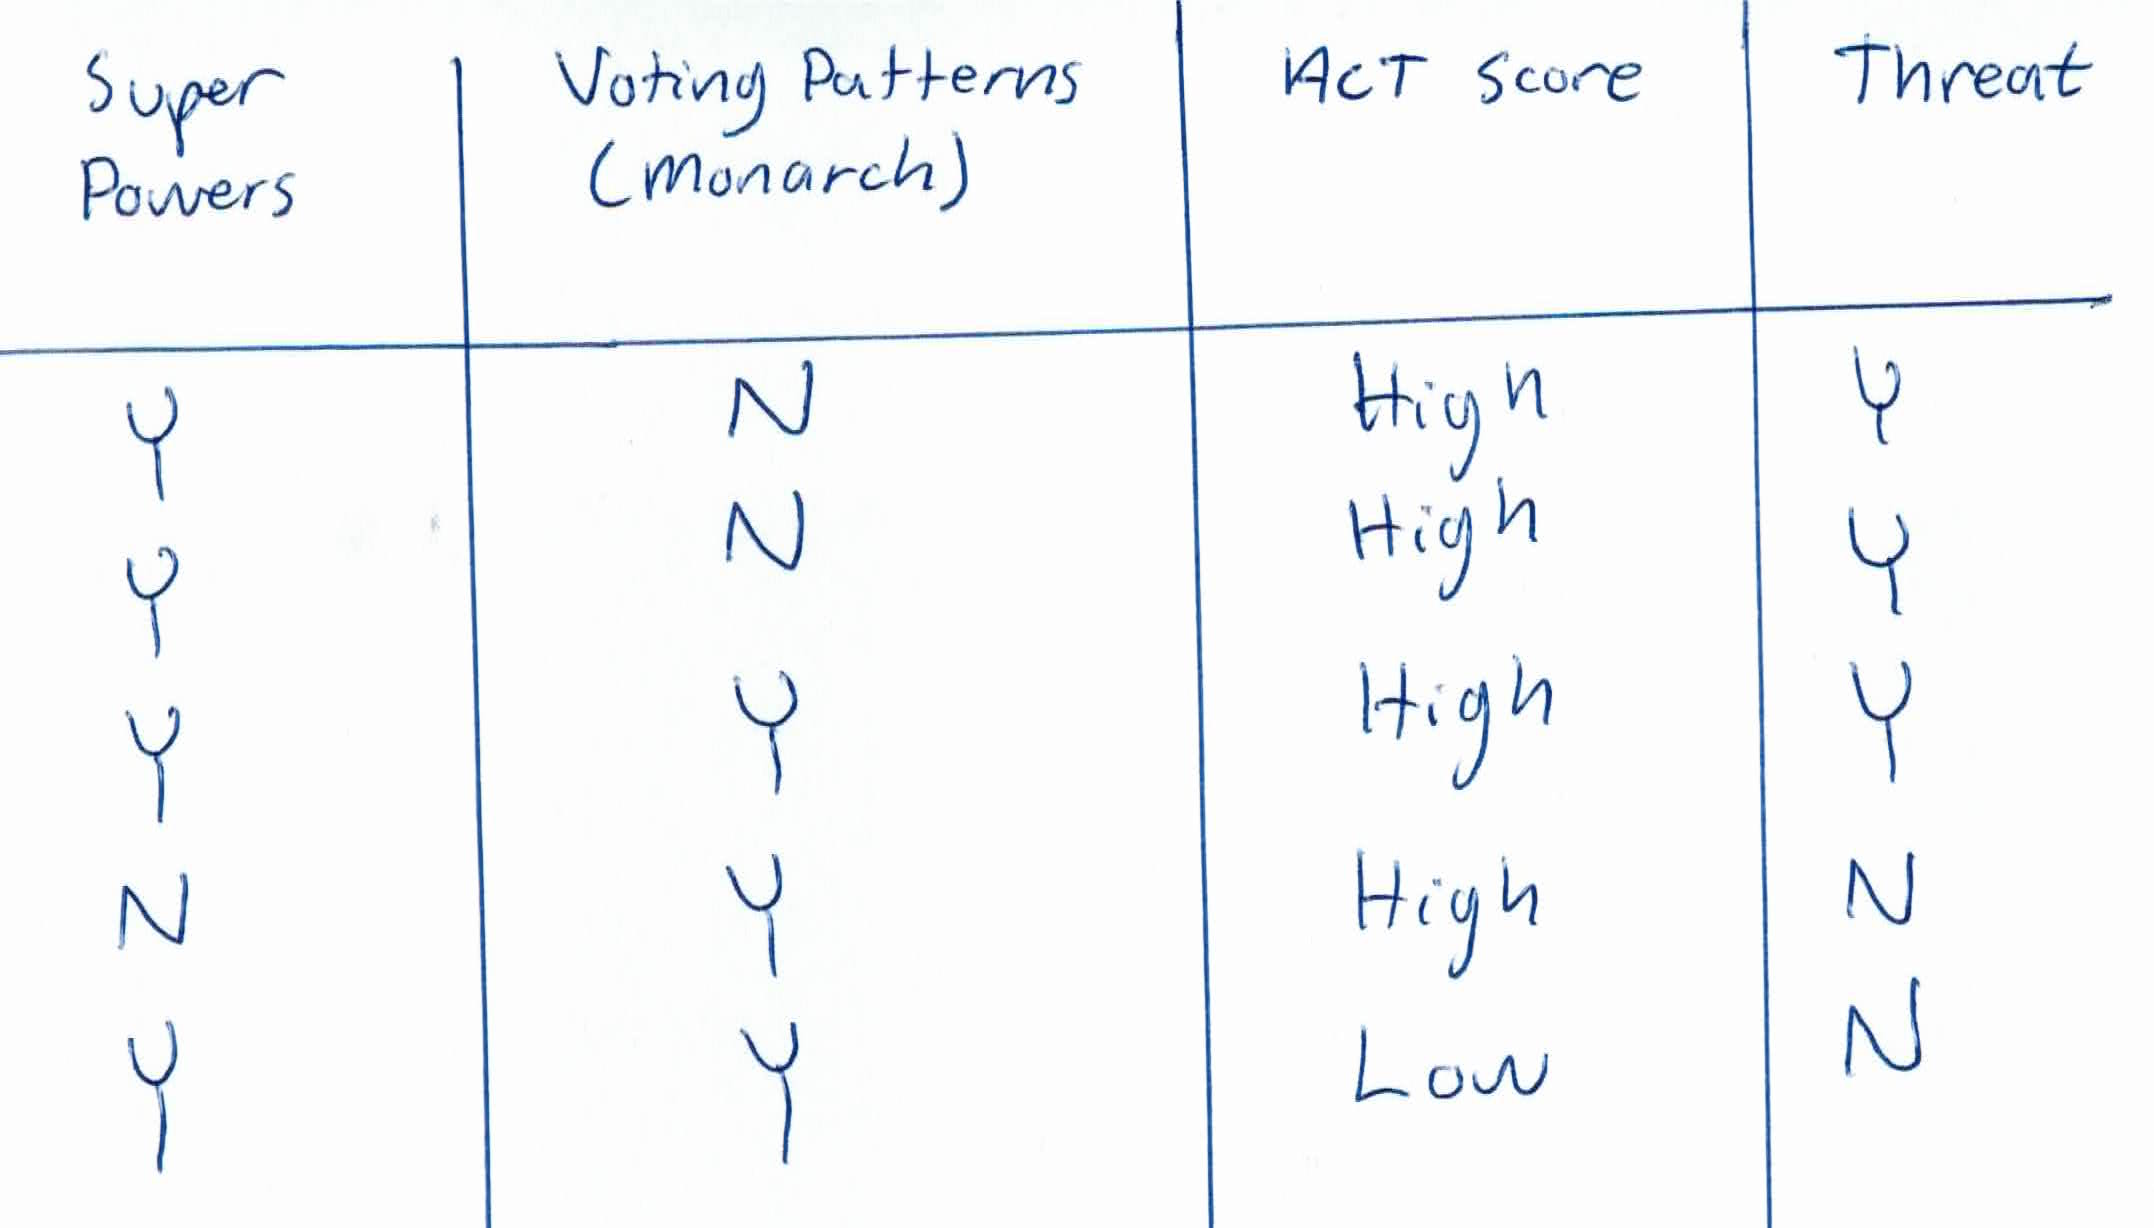
You are given 5 people and 3 categorical features, super powers, voting patterns, and ACT scores. Two of them are not a threat to HYDRA, and three of them are.
You start of by calculating the entropy of your labels (threat or not threat):
$$Entropy(threat) = -\frac{3}{5} log_2 (\frac{3}{5}) - \frac{2}{5}log_2(\frac{2}{5})$$
$$0.4422 + 0.5288 = 0.971$$
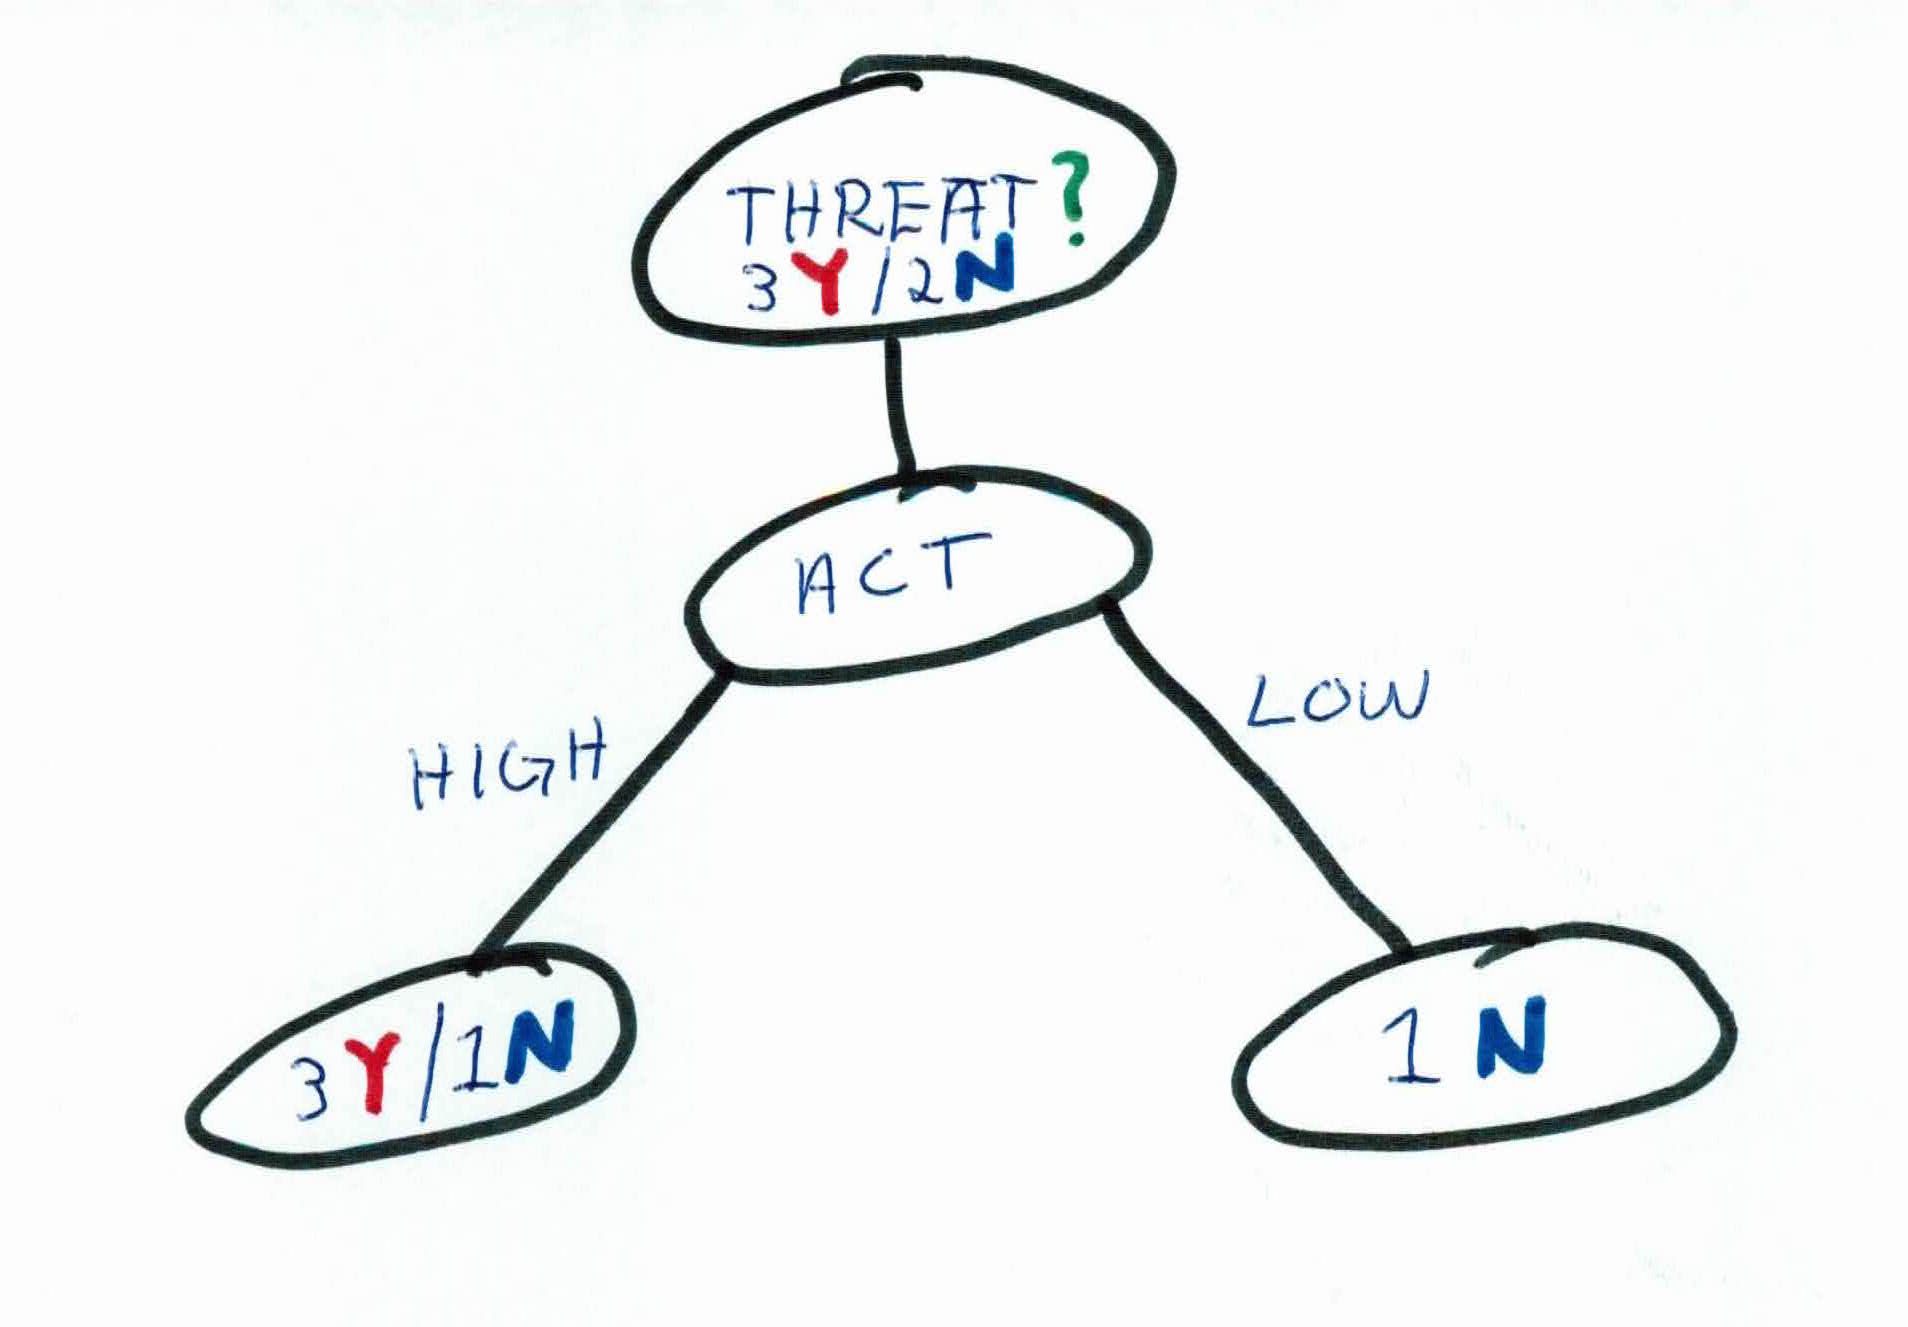
We then calculate the information gain of each feature if we were to use that as a rule to split the data:
$$Gain(threat, ACT) = 0.971 - \frac{4}{5}(-\frac{3}{4}log_2(\frac{3}{4}) - \frac{1}{4}log_2(\frac{1}{4})) + \frac{1}{5}(\frac{1}{1}log_2(\frac{1}{1})) $$
$$0.971 - \frac{4}{5}(0.8113) + \frac{1}{5}(0) = 0.3212$$
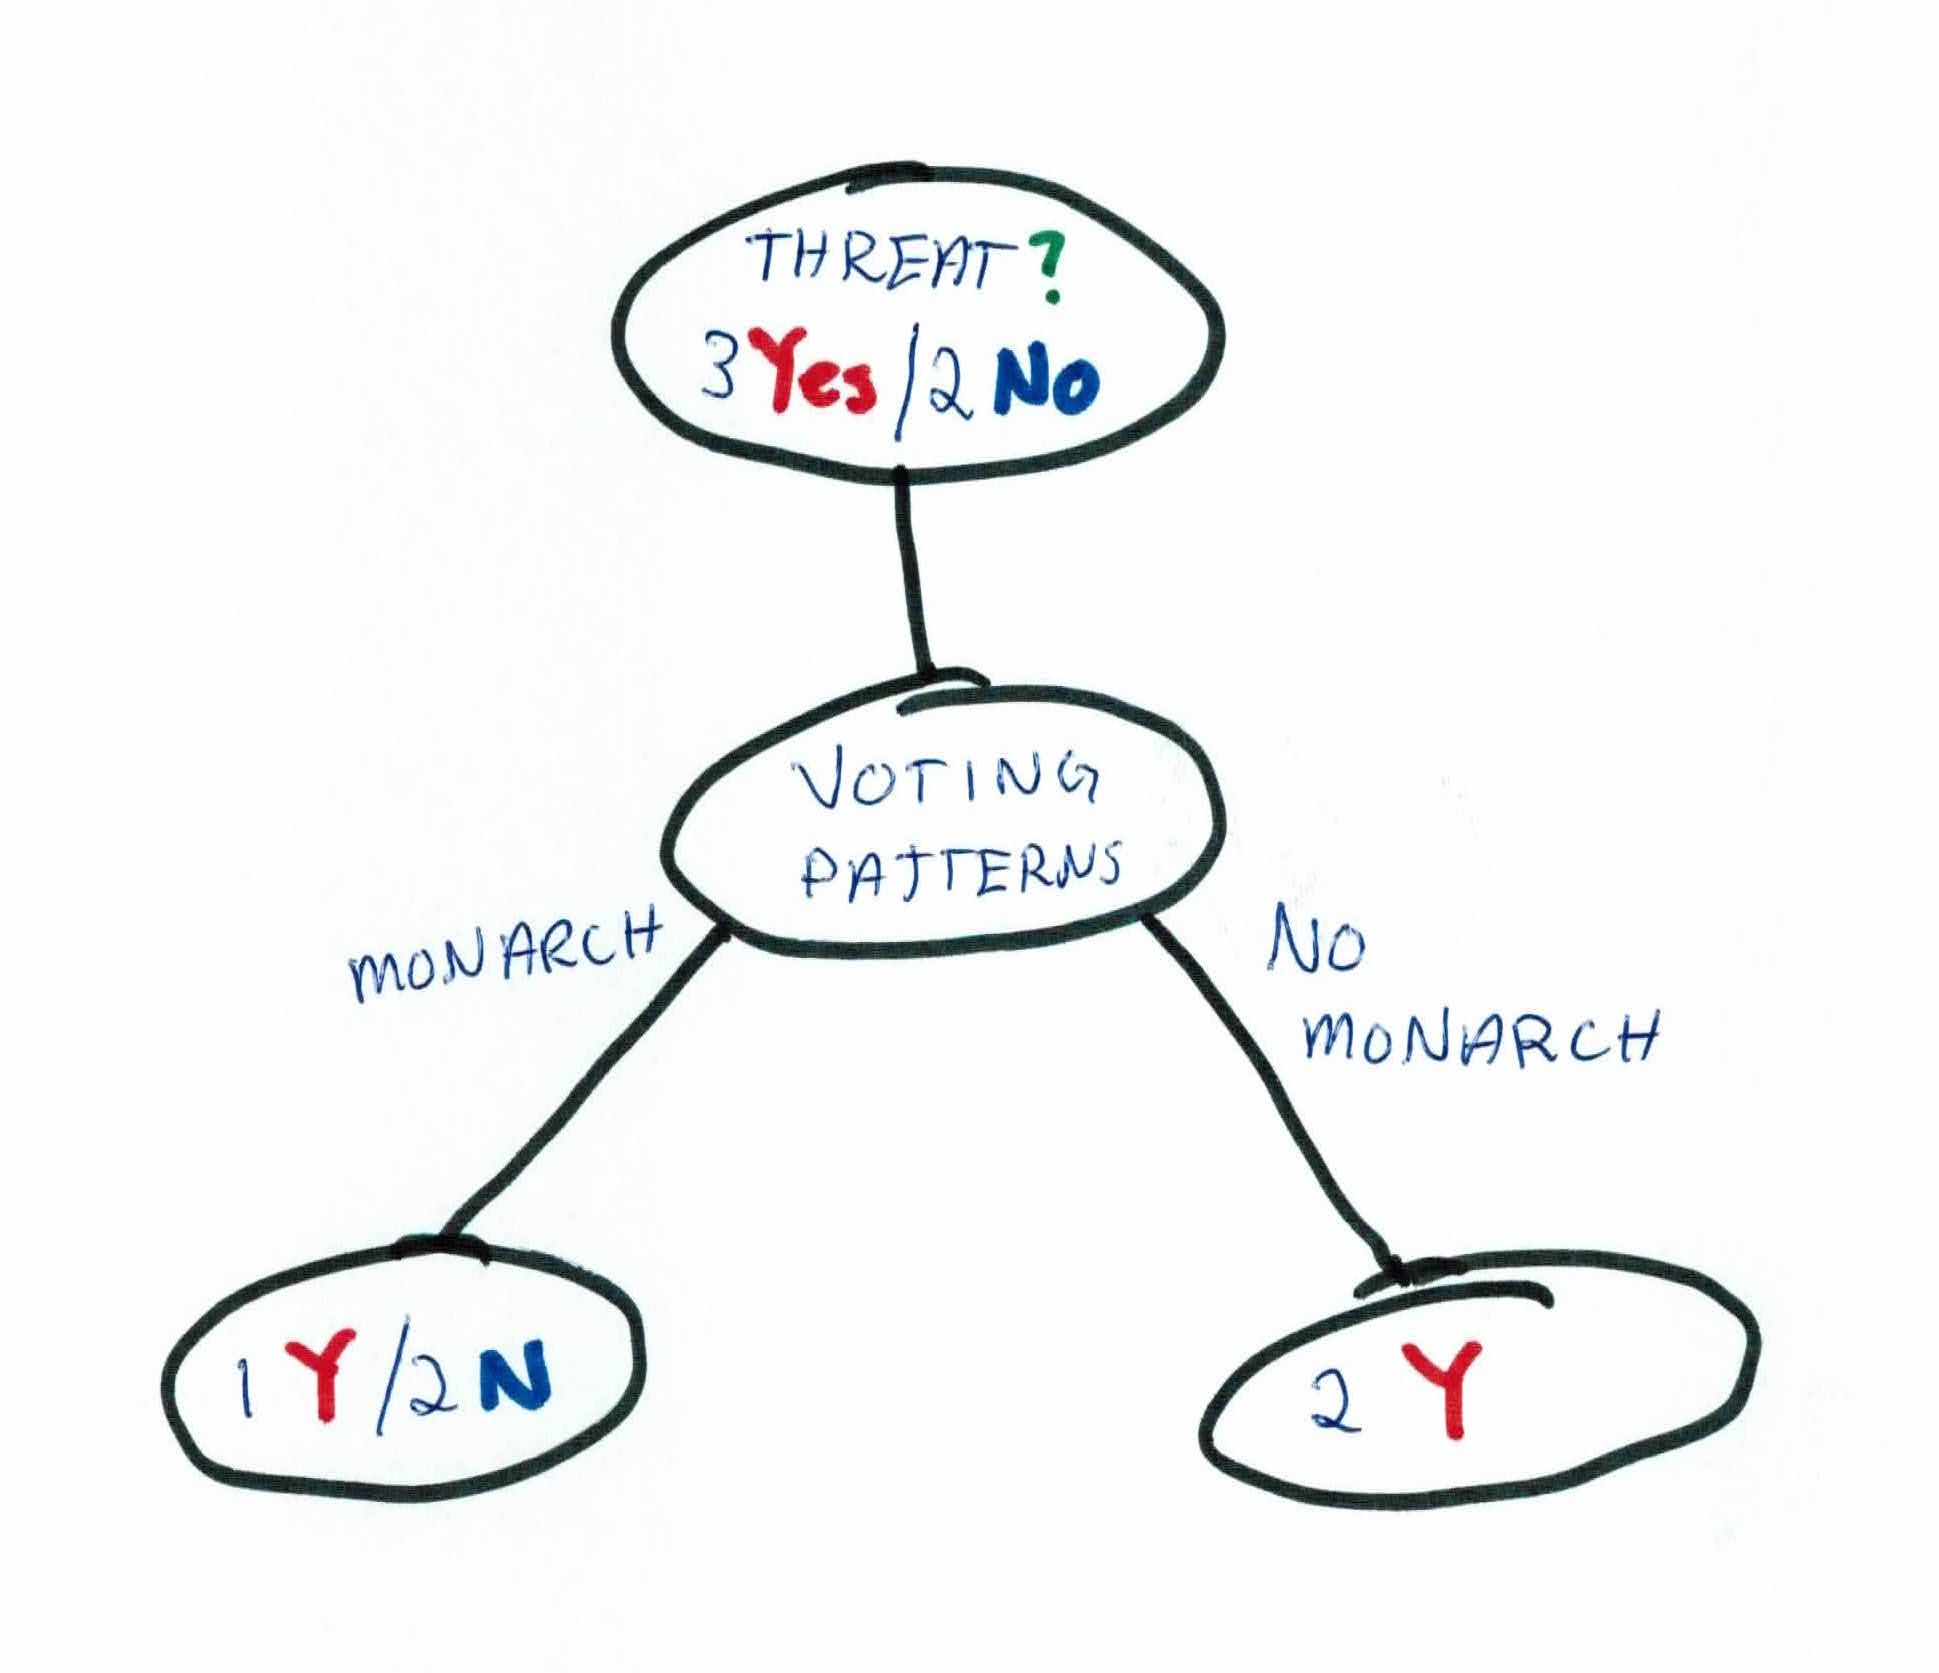
$$Gain(threat, voting \ pattern) = 0.971 - \frac{3}{5}(-\frac{1}{3}log_2(\frac{1}{3}) - \frac{2}{3}log_2(\frac{2}{3})) + \frac{2}{5}(\frac{2}{2}log_2(\frac{2}{2}))$$
$$0.971 - \frac{3}{5}(0.9183) + \frac{1}{5}(0) = 0.42$$
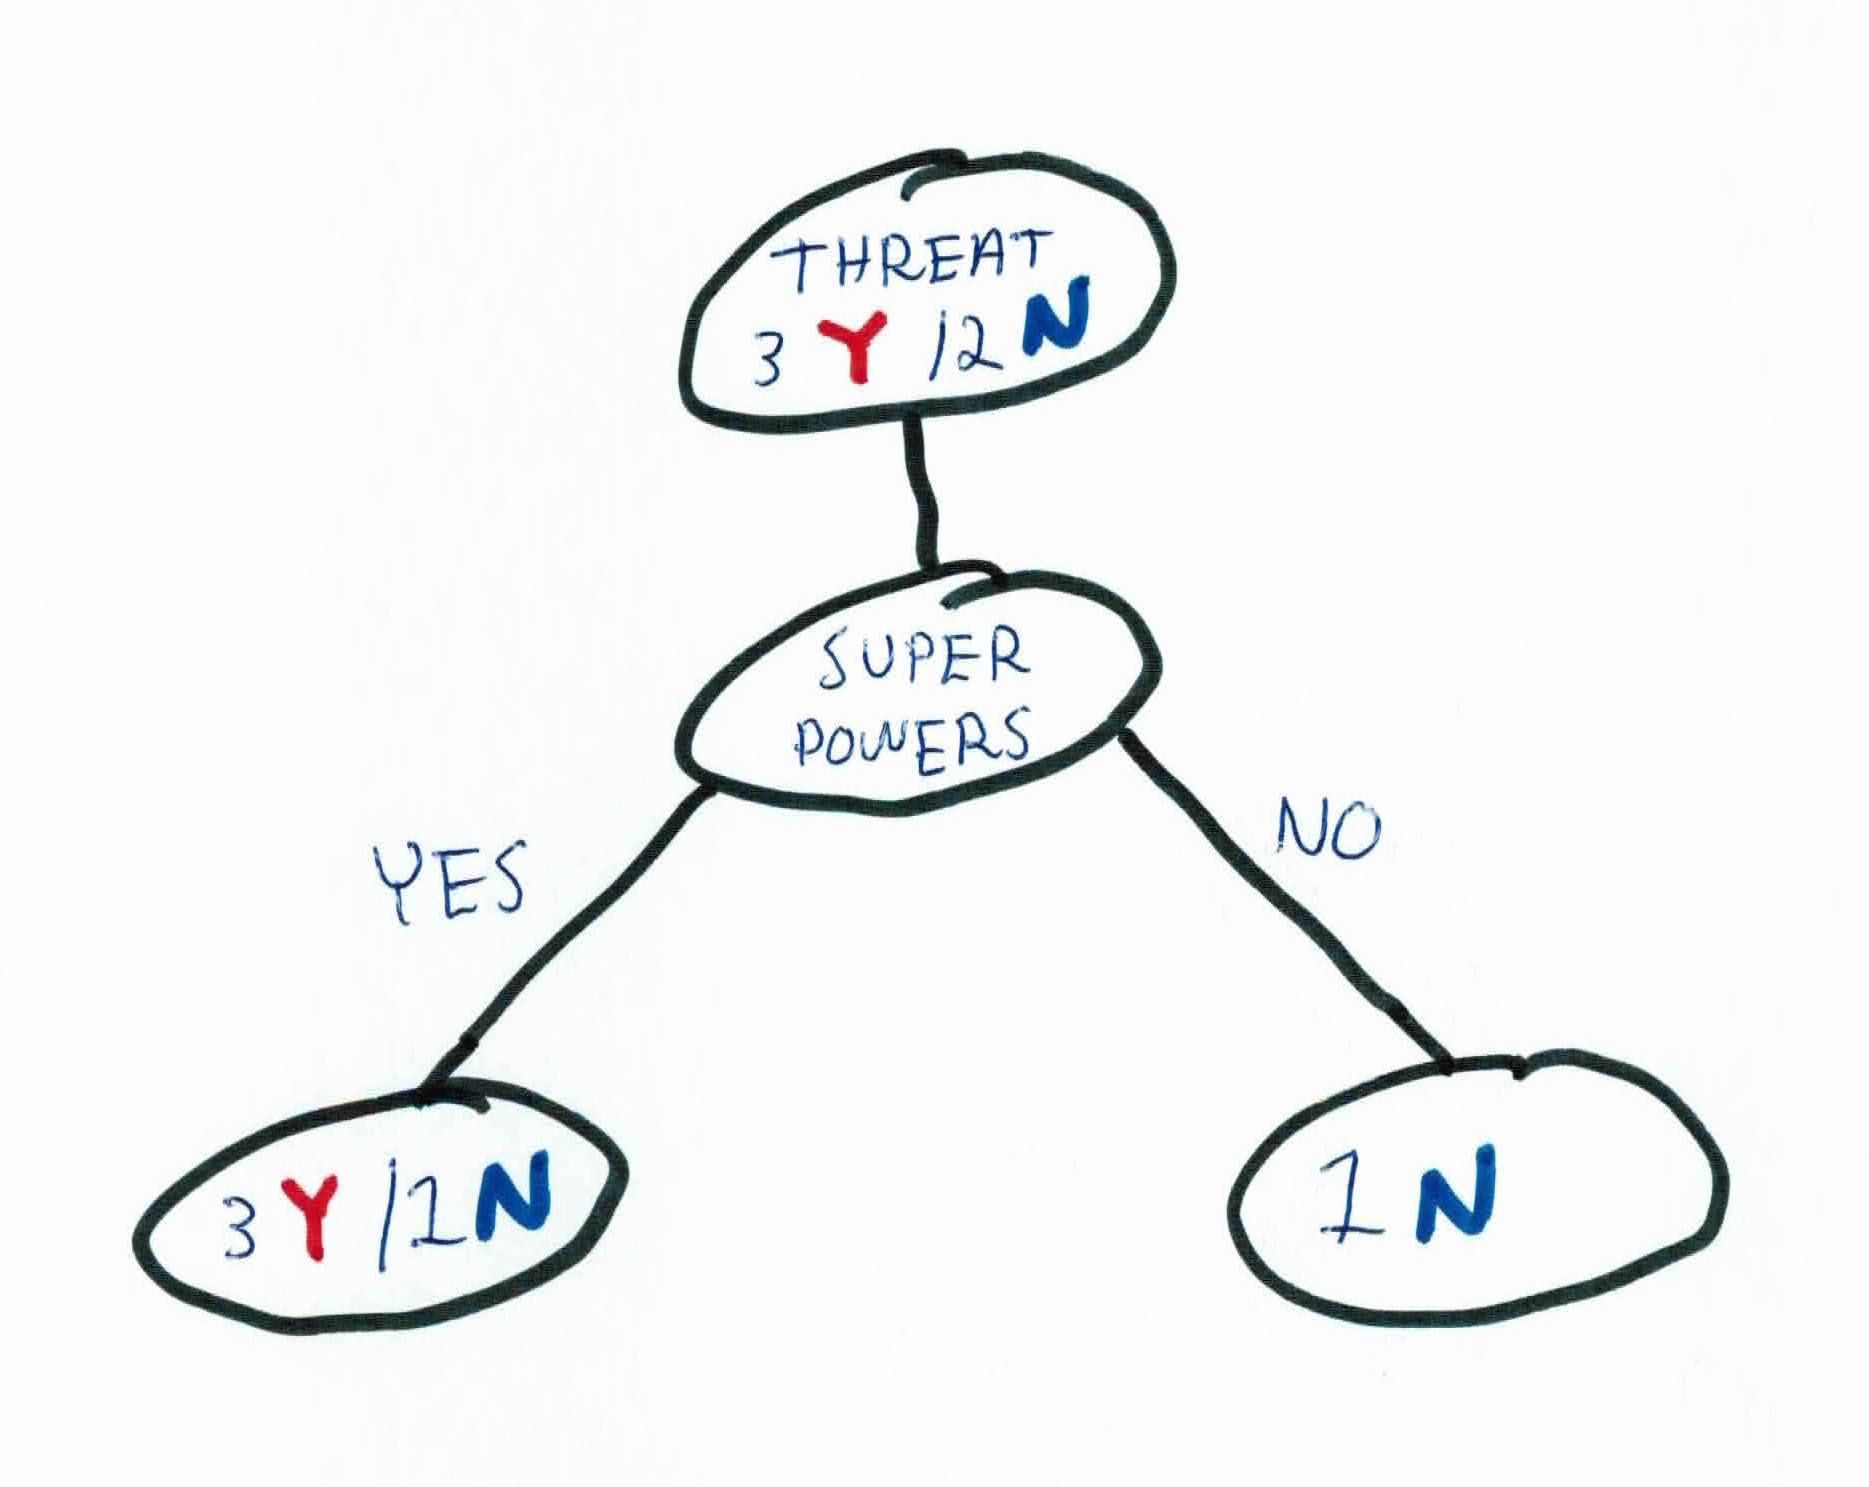
$$Gain(threat, super \ powers) = 0.9702 - \frac{4}{5}(-\frac{3}{4}log_2(\frac{3}{4}) - \frac{1}{4}log_2(\frac{1}{4})) + \frac{1}{5}(\frac{1}{1}log_2(\frac{1}{1}))$$
$$0.971 - \frac{4}{5}(.8113) + \frac{1}{5}(0) = 0.3212$$
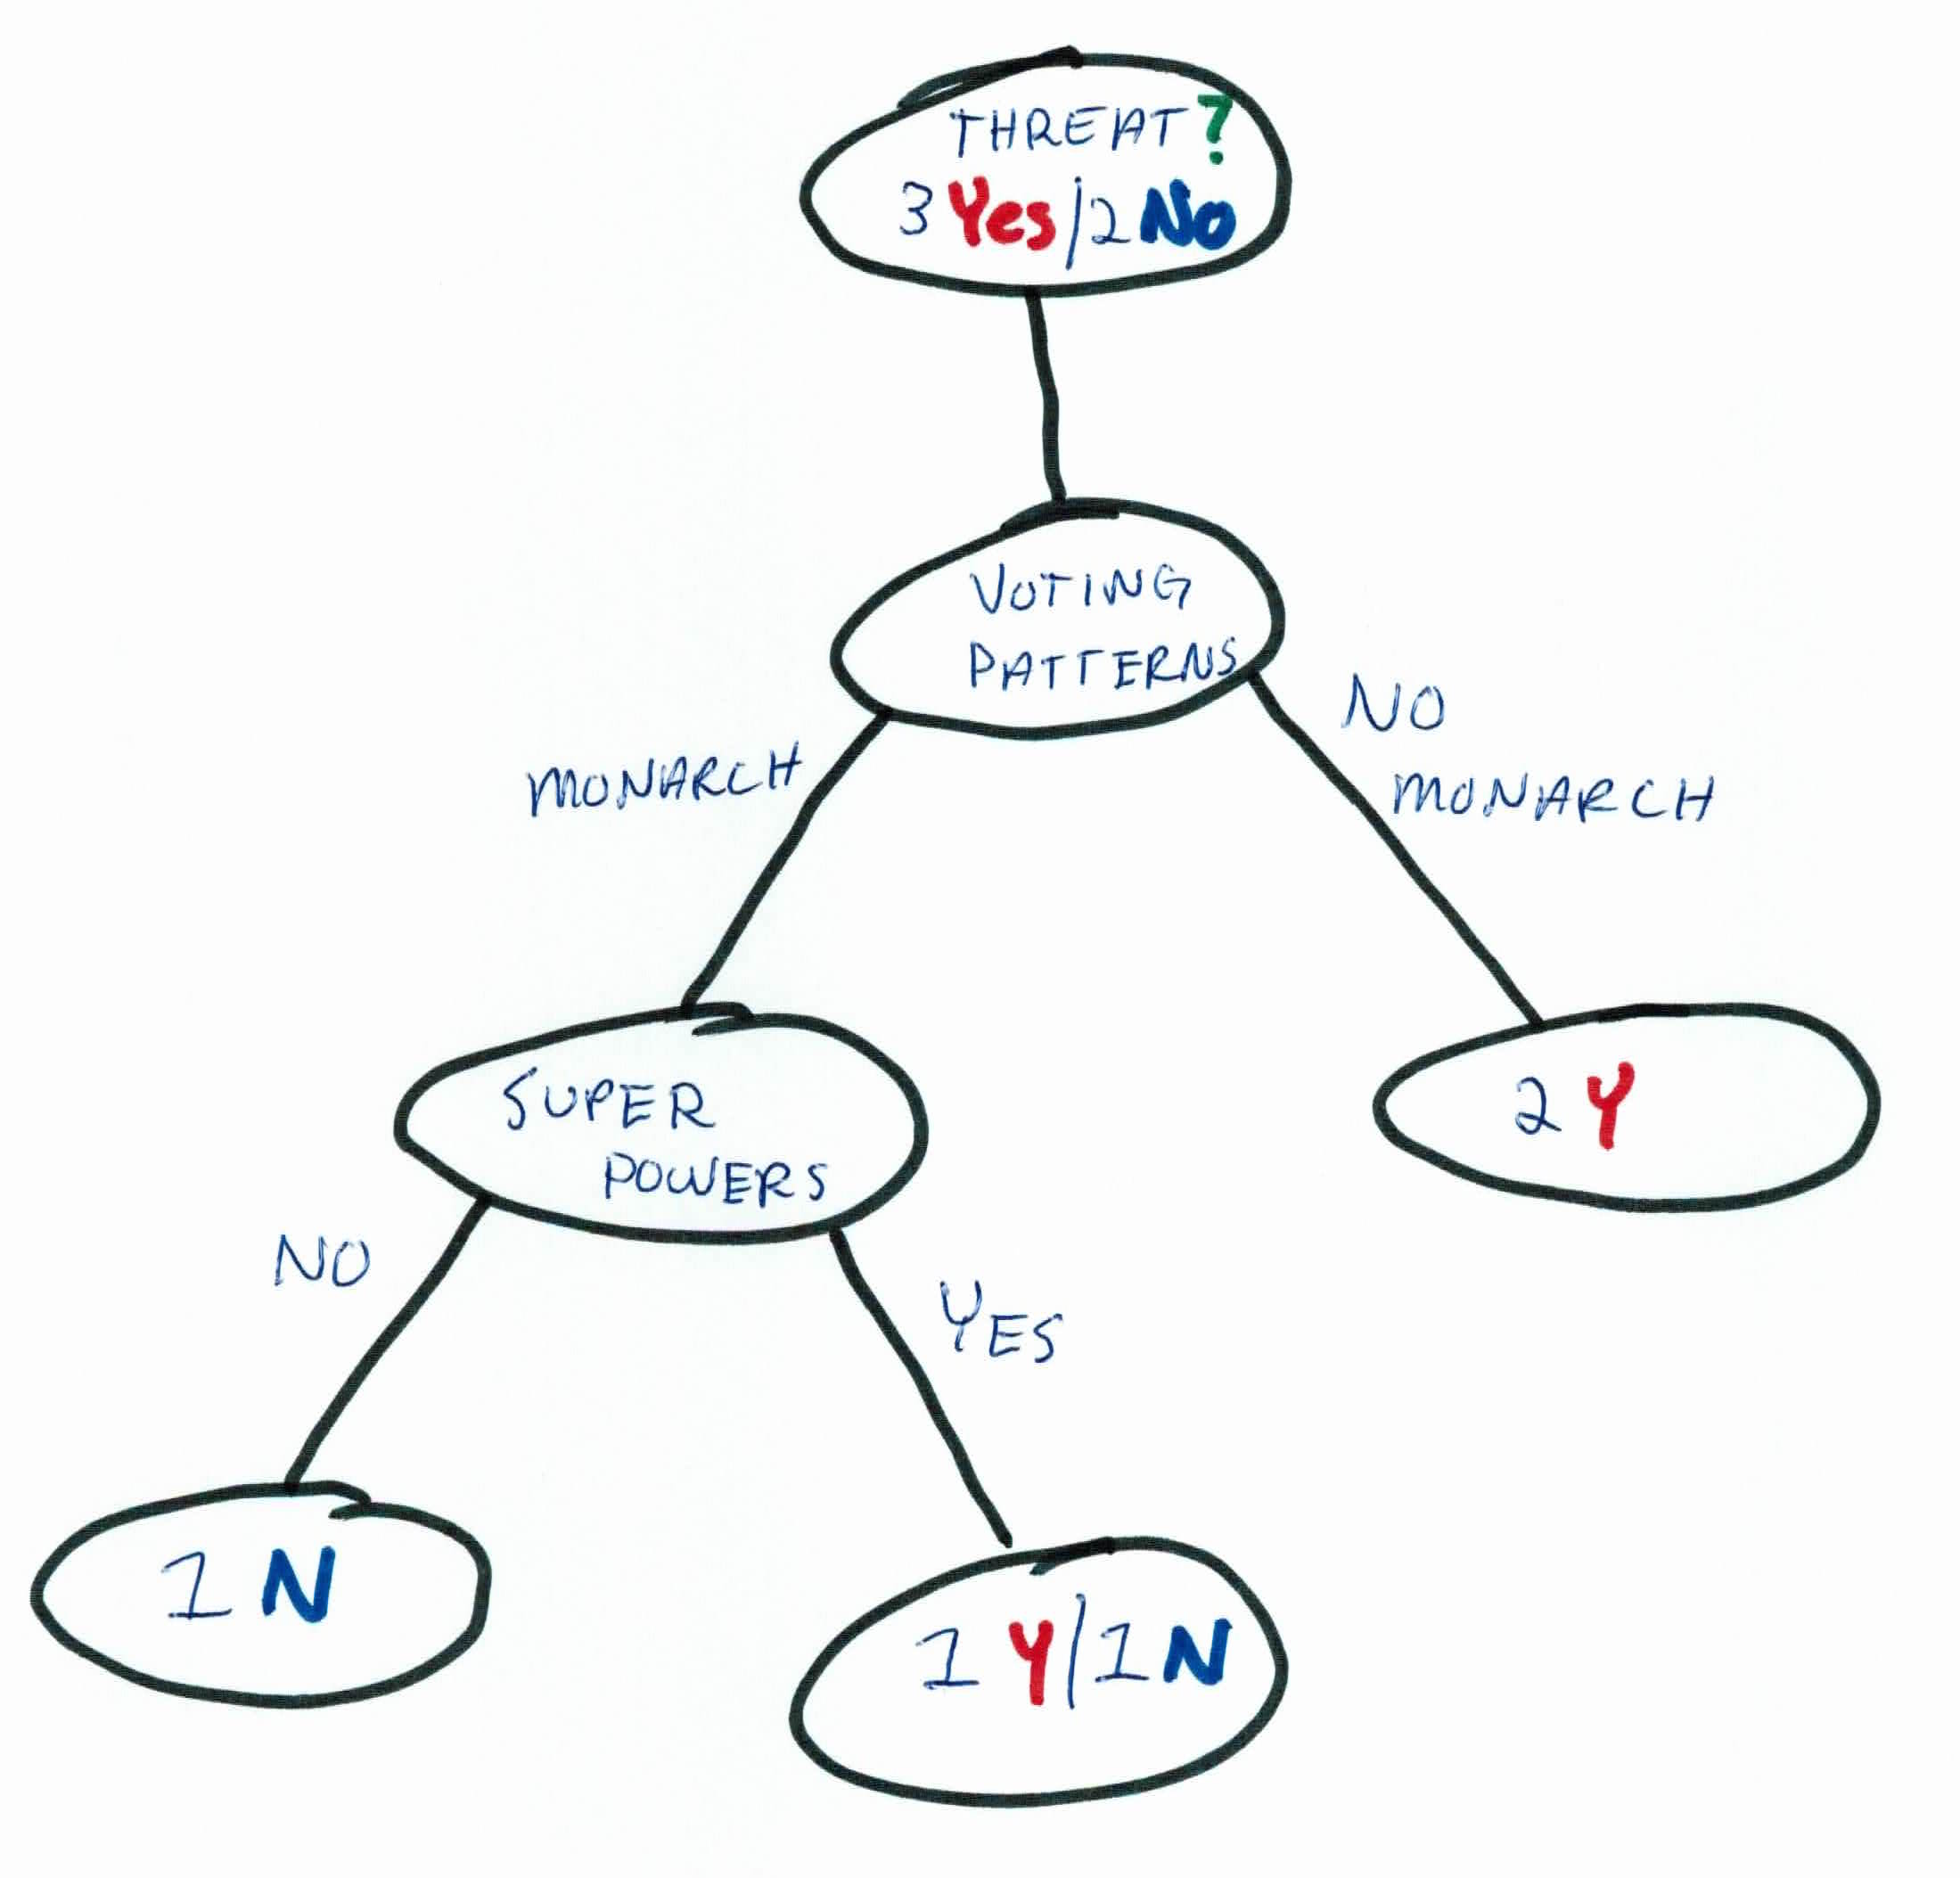
Based on our calculations, using voting patterns as our first rule will allow us to split the data and filter whether someone is a threat or not the best.
As you can see, that one rule hasn't completely filtered the data to allow us to predict whether a *new *person is a threat or not. So, we must iterate again and pick a new rule to go along with our existing tree.
We will now focus on the people that voted YES for a monarch. The person(s) who voted against having a monarch all uniformly have the same label and is now considered a leaf.
So the entropy of the remaining unfiltered people is:
$$E(threat) = -\frac{1}{3}log_2(\frac{1}{3}) - \frac{2}{3}log_2 (\frac{2}{3}) = 0.9183$$
We then calculate the information gain of the tree if we were to split at each remaining feature:
$$Gain(threat, super \ powers) = 0.9183 - \frac{2}{3}(-\frac{1}{2}log_2(\frac{1}{2}) - \frac{1}{2}log_2(\frac{1}{2})) + \frac{1}{3}(\frac{1}{1}log_2(\frac{1}{1})) $$
$$0.9183 - \frac{2}{3}(1) + \frac{1}{3}(0) = 0.252$$
$$Gain(threat, \ ACT) = 0.9183 - \frac{2}{3}(-\frac{1}{2}log_2(\frac{1}{2}) - \frac{1}{2}log_2(\frac{1}{2})) + \frac{1}{3}(\frac{1}{1}log_2(\frac{1}{1})) $$
$$0.9183 - \frac{2}{3}(1) + \frac{1}{3}(0) = 0.252$$
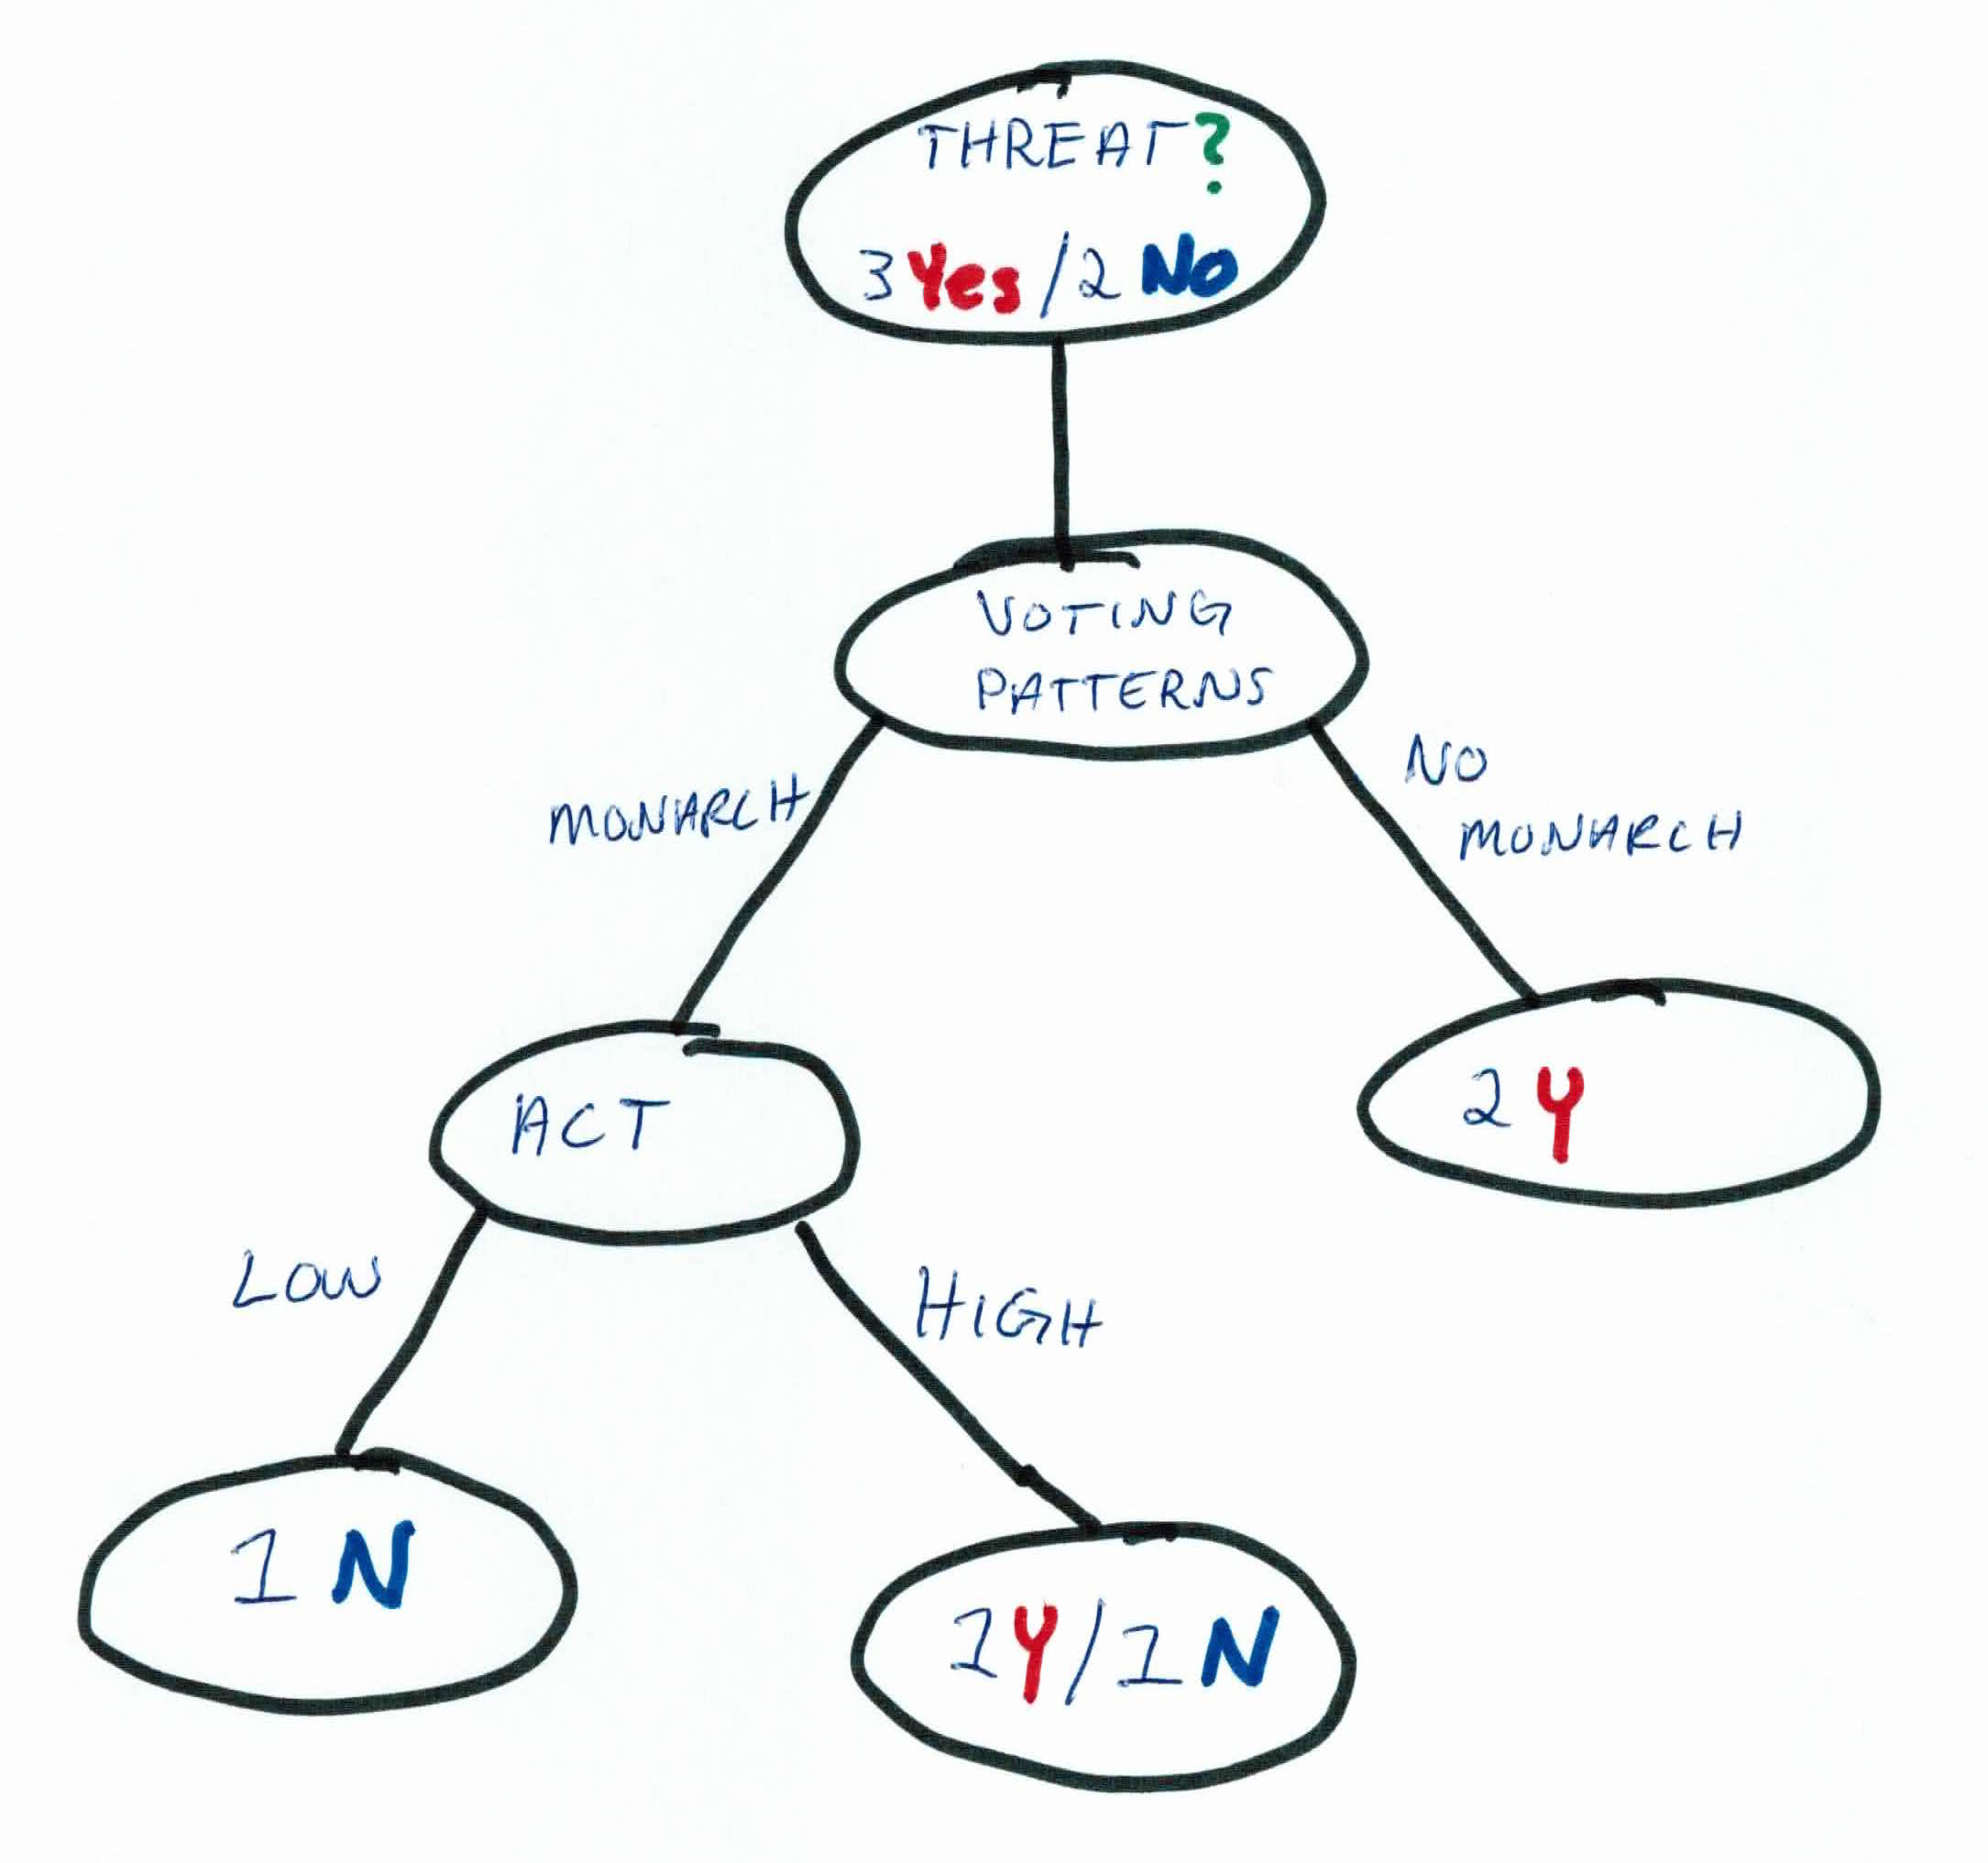
As you can see, both rules will filter the data the same! So, we'll choose to use ACT scores.
We still have a leaf node that needs filtering, so now we'll focus on the people who voted for a monarch and have high ACT scores. We'll use our last feature, super powers.
We could go through this data, calculating entropy and information gain, but it's easy to see that we can simply add super powers, and our final tree will update to:
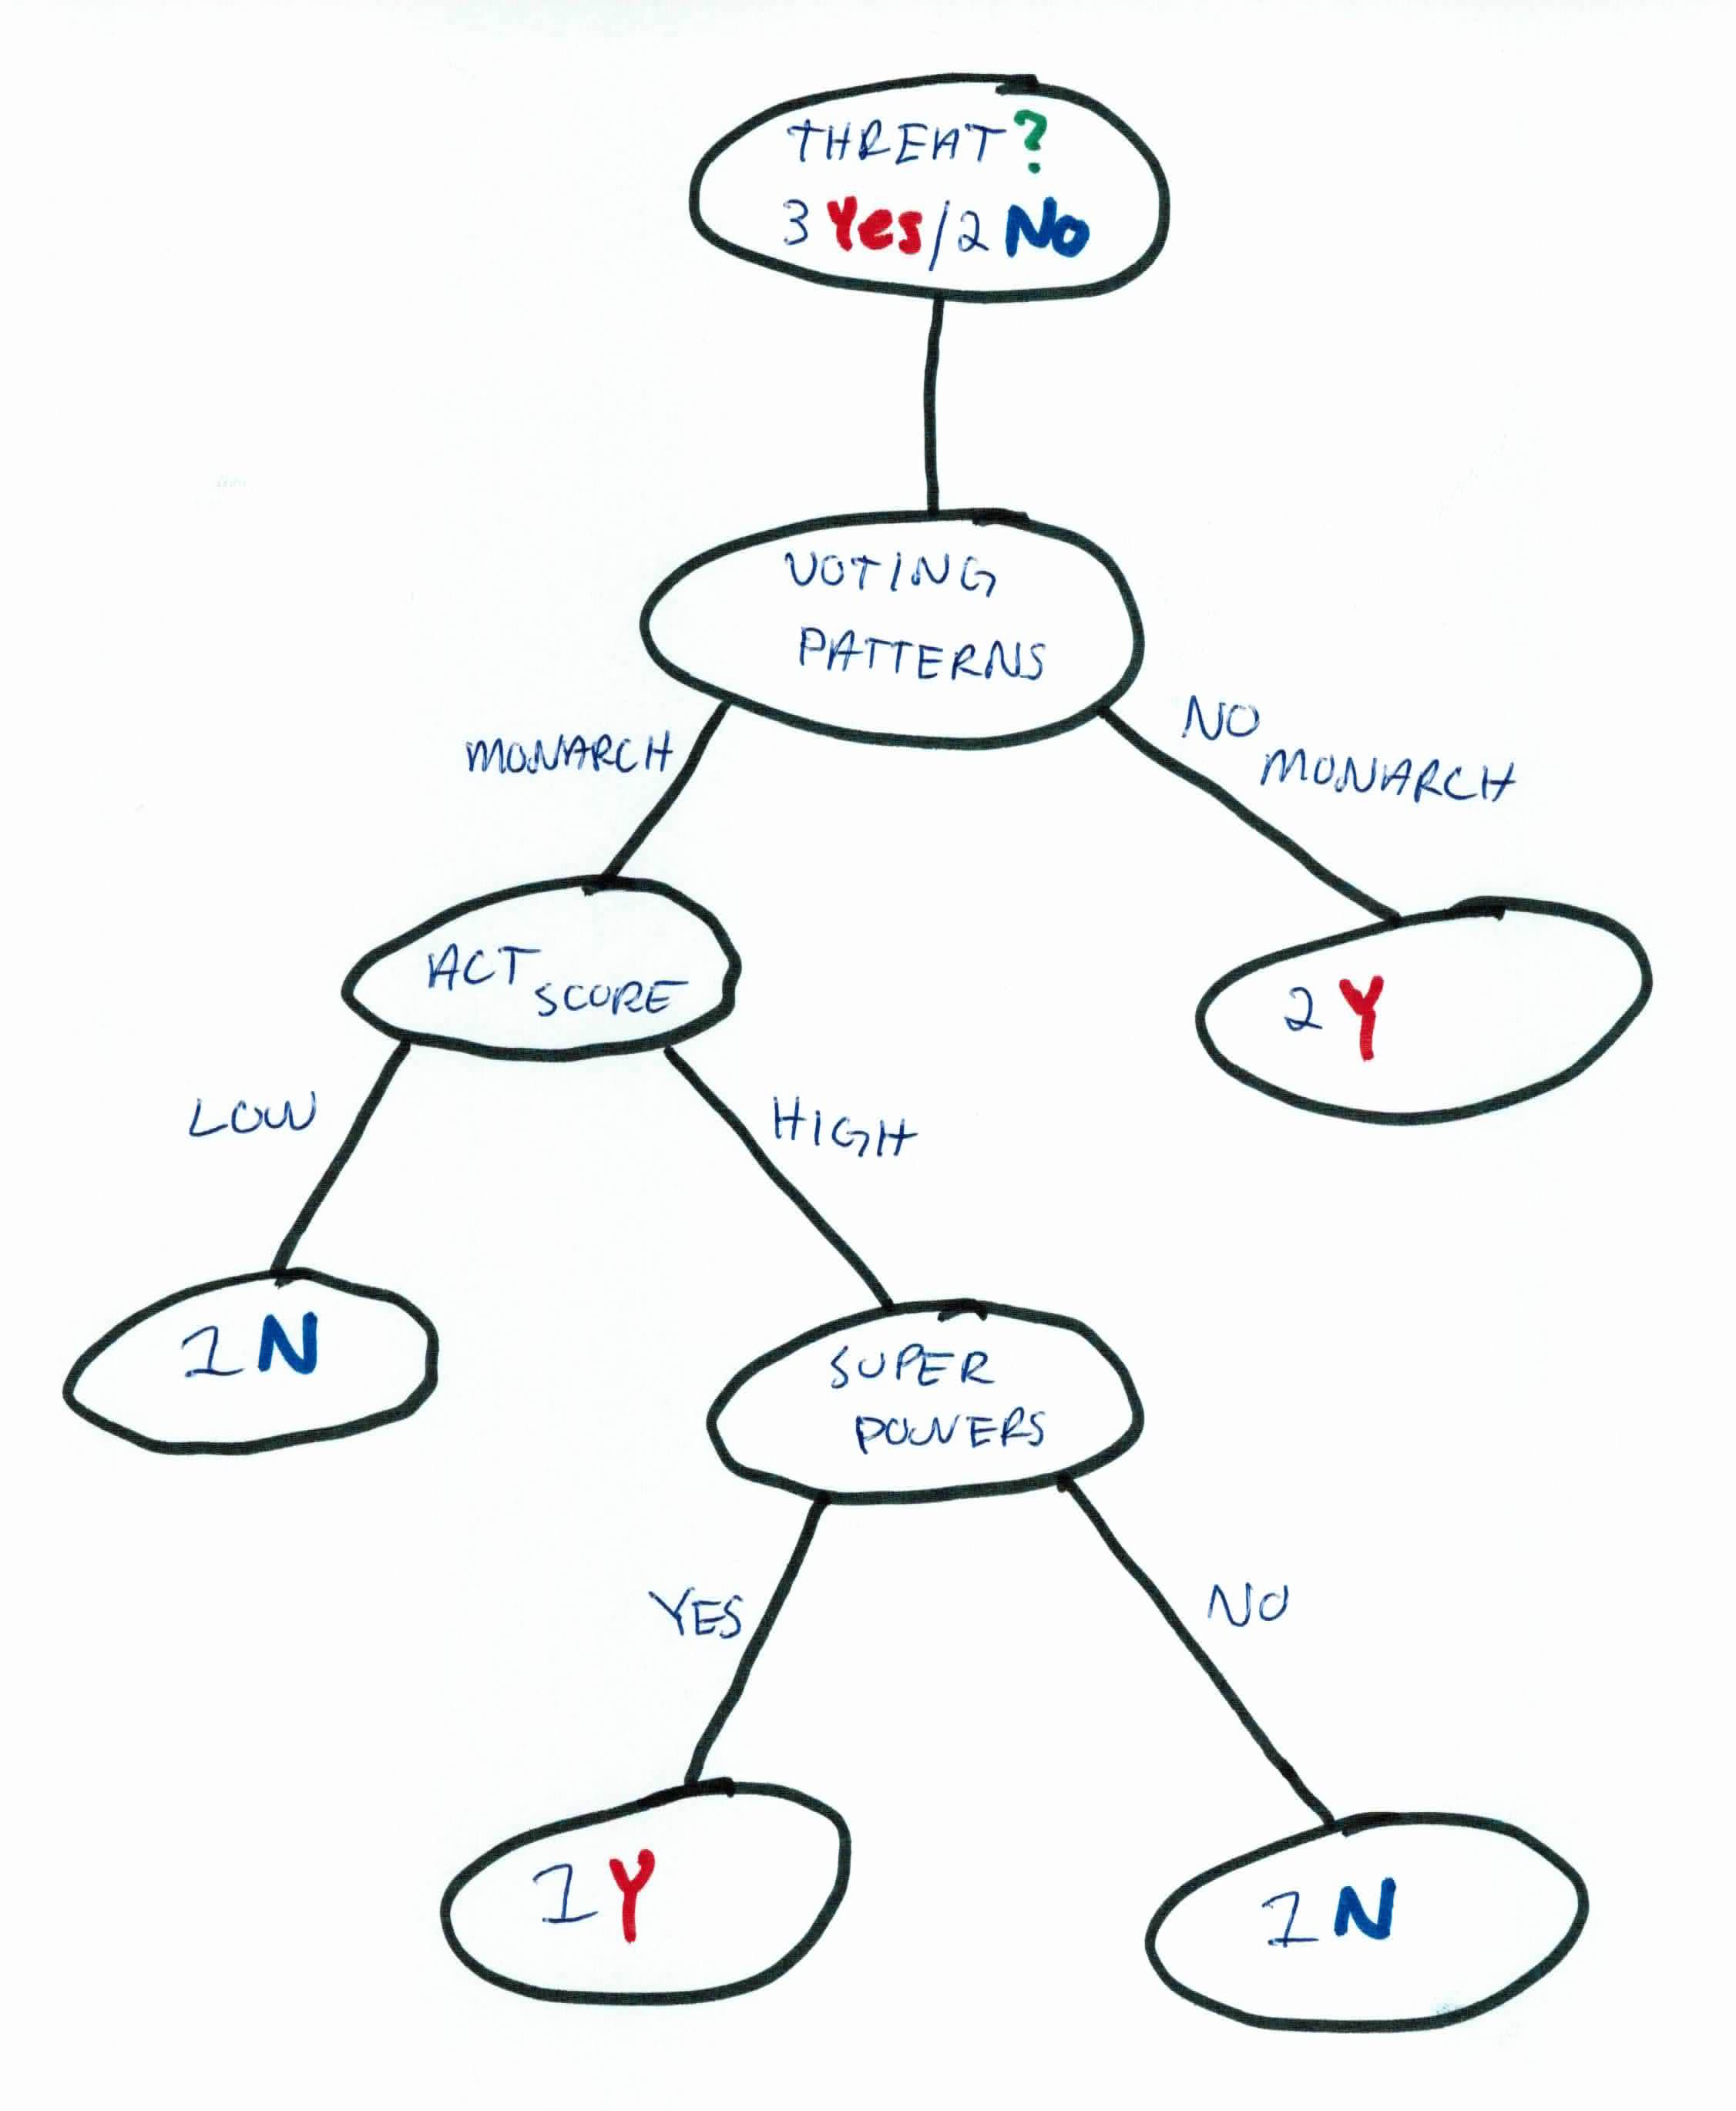
We now see that all the labels have been filtered and are uniform across each leaf. No further iterations are needed. Note that ACT and super powers could have been switched without affecting the algorithm.
For a new example, we can use these simple rules to predict:
$$IF (VOTING == YES) \ AND \ (ACT == HIGH) \ AND \ (POWER == YES) \rightarrow THREAT$$
$$IF (VOTING == NO) \rightarrow \ THREAT$$
$$ELSE \rightarrow \ NO \ THREAT$$
Decision trees are intuitive, interpretable, and simple to build algorithms. The goal is to create a predictive model that predicts the value of a target variable by learning simple decision rules inferred from the data features. Decision trees are well-suited for categorical data and there are no need to scale the data.
Decision trees learn from data to predict with a set of if-then-else decision rules. The deeper the tree, the more complex the decision rules and the fitter the model. You can generate trees from a variety of algorithms with C4.5 being the most common one. You build the tree based on the goal of trying to lower the entropy of all leaf nodes/labels. For each feature (left) you calculate the information gain and the highest one will be the next feature you split at, as it means you will split the data the best and learn the most.
Other observations: